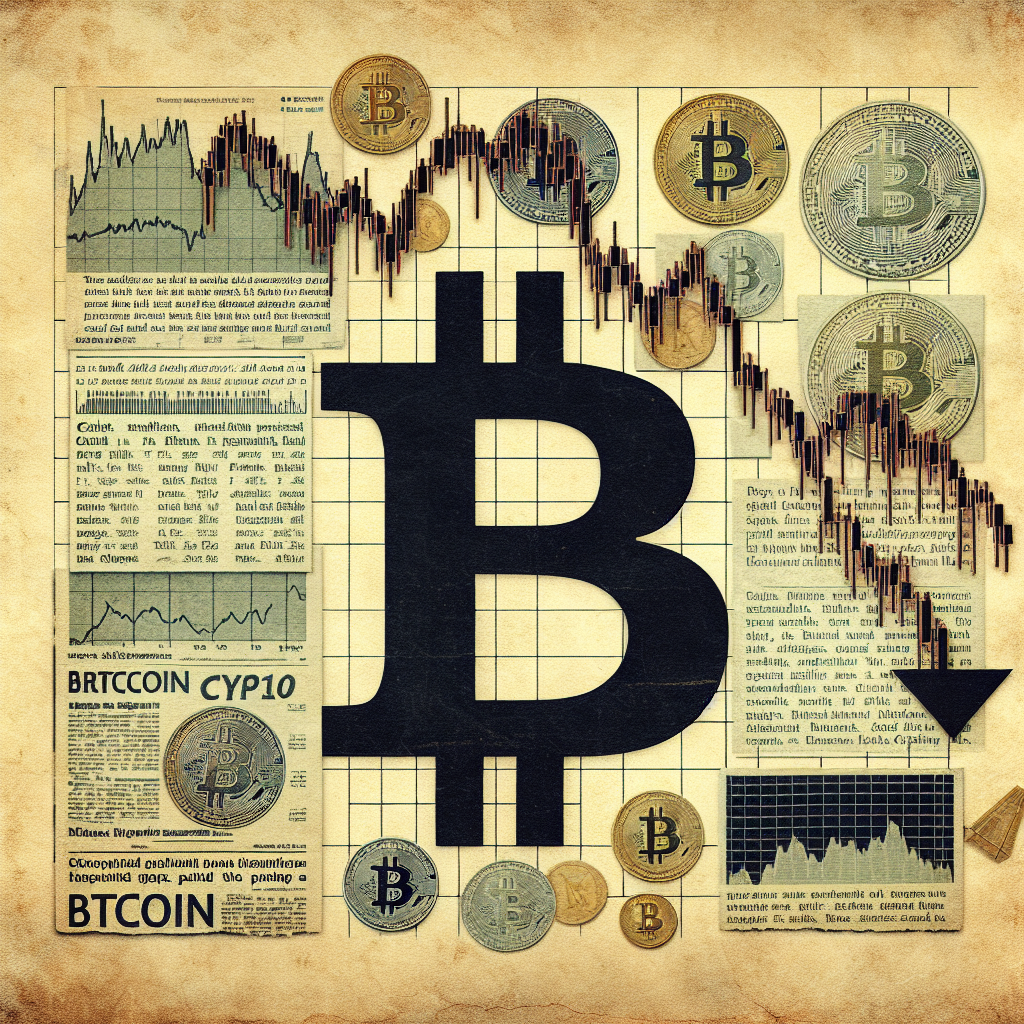
Why is Bitcoin Price Stuck?
Bitcoin’s price has been stuck within a wide range, but multiple indicators suggest this pattern might soon change. Let’s dive into the reasons behind BTC’s current price stagnation and what might be coming next.
Lackluster Demand for Bitcoin
One of the primary reasons for Bitcoin’s stagnant price in recent weeks is low demand. Data from Glassnode reveals that Bitcoin has been trading within a roughly $4,700 range over the past 10 days, with the $60,000 level acting as stubborn resistance.
Minimal Capital Inflows
Despite inflows into Bitcoin investment products totaling $436 million over the week ending September 13, BTC’s price has continued its range-bound behavior. Glassnode explains that the Bitcoin market is currently characterized by minimal capital inflows, which is why BTC price has been trading in a range-bound manner for the last six months.
Realized Cap Plateau
The Realized Cap, which measures the value of all coins in circulation at their last moved price, has peaked and plateaued at $622 billion over the previous two months. This suggests that most coins being transacted are doing so close to their original acquisition price.
Net Realized Profit / Loss
Using the Net Realized Profit / Loss metric, which assesses the daily change in on-chain capital flows for Bitcoin, Glassnode indicates that both profit and loss forces are largely equal. This results in a marginal net flow and suggests a degree of equilibrium in the market.
Minimal Profit and Loss-Taking
Glassnode analysts also used the Sell-Side Risk Ratio to assess the absolute sum of realized profit and loss locked in by investors relative to Bitcoin’s Realized Cap. The findings revealed that this metric has dropped below the “low-value band,” suggesting minimal profit and loss-taking at current price levels. This indicates that equilibrium has been reached, and there is a need for further range expansion to incentivize investors to spend their coins.
Market Structure and Buyer-Seller Stalemate
Additional data from market intelligence firm IntoTheBlock shows the ongoing stalemate between buyers and sellers. The in/out of the money around price (IOMAP) model reveals that the price is currently between two significant levels. There is robust support around the $58,000 to $59,700 demand zone, where approximately 954,240 BTC were previously bought by 2.1 million addresses. On the upside, the supplier congestion zone between $59,800 and $63,000 poses a stiff barrier for the bulls. This is where approximately 1.2 million BTC were previously bought by roughly 3.02 million addresses.
Bitcoin Liquidation Heatmap
The Bitcoin liquidation heatmap by Coinglass reveals heavy ask orders above the spot price and bid positions below. This highlights the relative tightness of the current market structure.
Conclusion
While Bitcoin’s price remains stuck within a wide range, multiple data points suggest that this pattern might soon come to an end. Factors such as minimal demand, capital inflows, and equilibrium in profit and loss-taking are contributing to the current price stagnation. However, the market’s tight structure and the ongoing stalemate between buyers and sellers indicate that a breakout might be on the horizon.